How to Extract Table Data from an Image to CSV
Turn a photo of a table, order sheet, or delivery slip into a clean CSV file. Learn how space-ocr handles line items and ensures each row is extracted correctly.
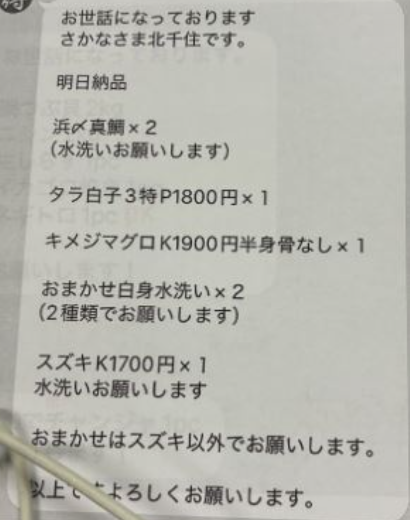
Getting data from a scanned table into a spreadsheet is a classic chore. You have a crisp image of a delivery slip or a purchase order, full of line items. But it's just pixels. The next step is usually tedious, manual data entry, copying each item, quantity, and price into a new row, one by one. The process is slow and a single typo can throw off your entire dataset.
A better approach is to treat the table's structure as a template. Instead of just pulling out a single block of text, you can define the columns you need. For the repeating section of line items, you define it as an array with its own sub-columns like name, unit_price, and quantity. When you upload an image, space-ocr processes it against this structure, turning each row from the image into a structured entry.
This works even for dense tables with repeating values, which can be a challenge. The system uses a large language model to propose the initial extracted text, but it doesn't stop there. For each value, like an item name of "刻みたくあん" or a unit_price of "580", it cross-validates the result. The engine checks the language model's hints against the document's column structure and performs a character-by-character match against the symbols originally detected on the page. This verification step prevents data from drifting between adjacent rows.
Every extracted value is verified against the source image. The AI's proposed text is checked by matching its characters against the actual OCR symbols found on the page. This process generates a match_ratio confidence score; a score of 0.85 or higher indicates a confident match. The bounding box coordinates for each value are derived from these matched symbols and normalized to a 0–1000 scale, providing a verifiable audit trail for every piece of data.
The cost is based on usage, at $0.05 per image processed. Your account includes 100 free scans every month. If an extraction fails for any reason, there is no charge.
- Define a Sheet SchemaCreate a new Sheet and define your columns. For line items, use the 'array' type and add child columns for name, quantity, price, etc.
- Upload Your ImageDrag and drop or use the API to upload an image of the table to the Sheet.
- Review the Extracted DataThe image will be processed against your schema. Each line item from the table appears as a structured row in the Sheet.
- Correct if NeededClick on any cell to see the corresponding area on the image. Manually correct any values directly in the grid.
- Export to CSVClick the 'Export' button and choose CSV. Your table data, including all line items, is downloaded as a clean, structured file.
What if my table has merged cells or a complex layout?
How does CSV export handle the line items?
Can I process PDF files with tables?
How are the coordinates for each cell determined?
Is there a limit to the number of rows in a table?
Turn Your Image Tables into Data
Get 100 free scans every month. No credit card required to start.